Echarts在线免费图表
地图工具
FlexBuilder
时间戳转换
WebSocket在线工具
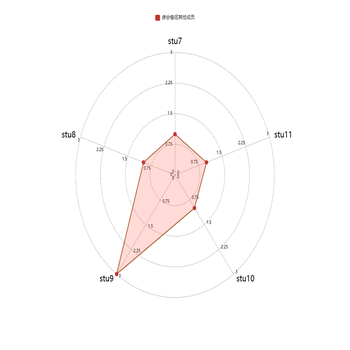
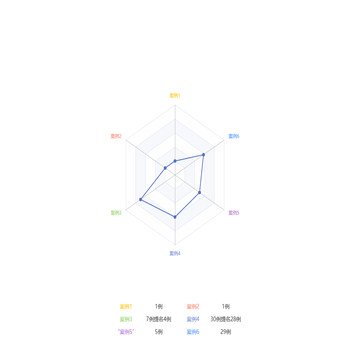
描述:当前是关于其它图表中示例。
格式化
运行代码
其它相关图表


![[电气数科]雷达图](https://www.mjrooo.com/assets/image-173371486022849.png)