Echarts在线免费图表
地图工具
FlexBuilder
时间戳转换
WebSocket在线工具
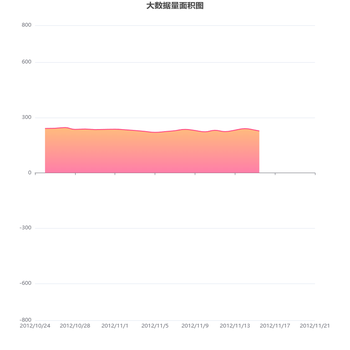
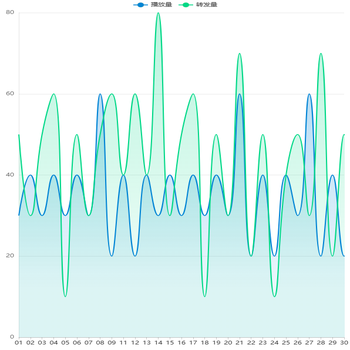
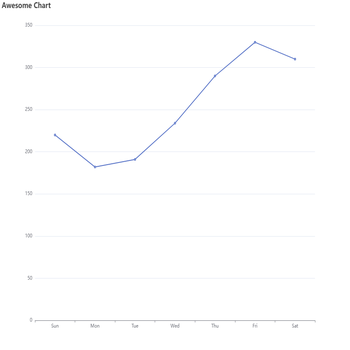
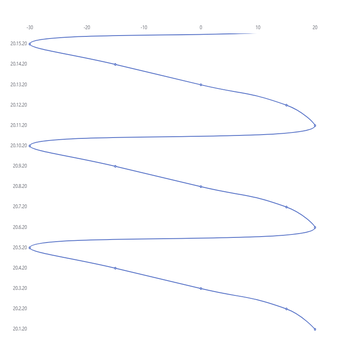
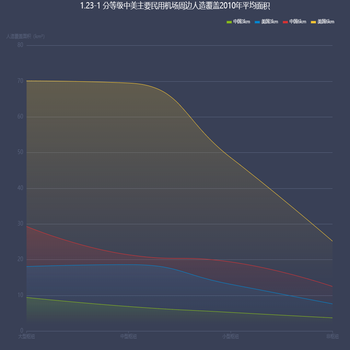
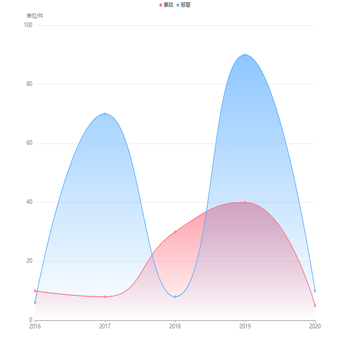
描述:当前是关于其它图表中示例。
格式化
运行代码
其它相关图表
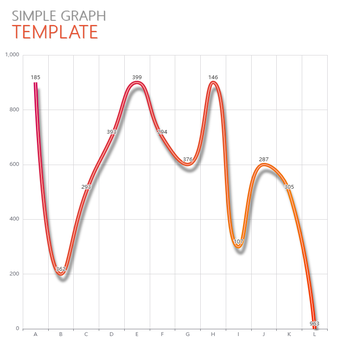
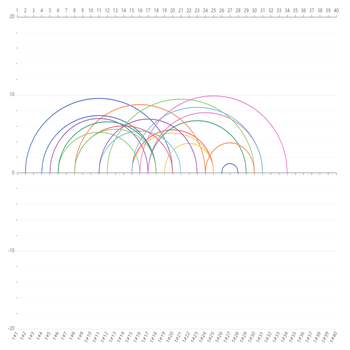
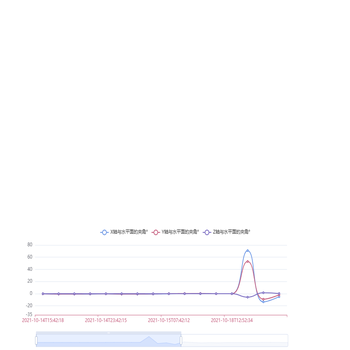
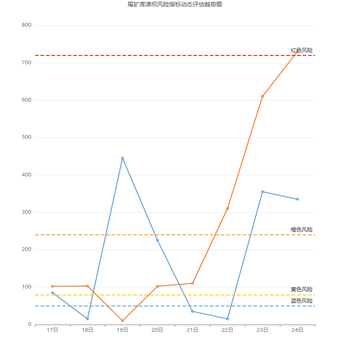
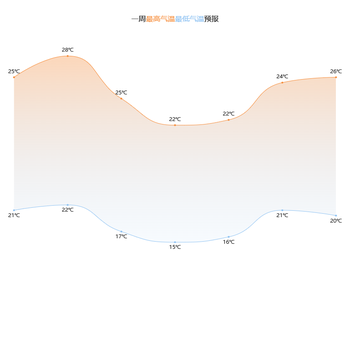
![图表下面的X轴 一周 日期要做成实时 周期,并且循环播放,怎么做? 还有下面的series: {data:[ ]},怎么设置动态获取7个参数后与X轴标签联动。](https://www.mjrooo.com/assets/image-173337977195516.png)