Echarts在线免费图表
地图工具
FlexBuilder
时间戳转换
WebSocket在线工具
描述:当前是关于其它图表中示例。
格式化
运行代码
其它相关图表
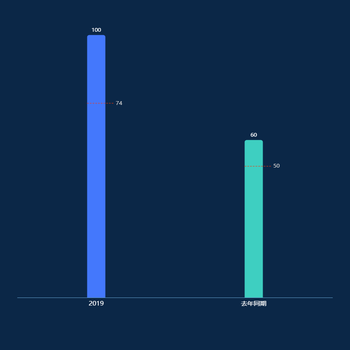


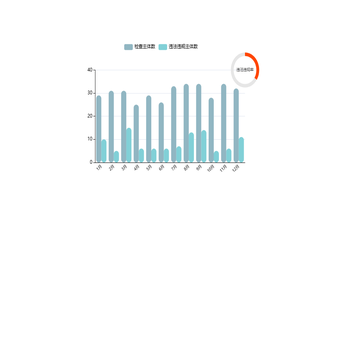

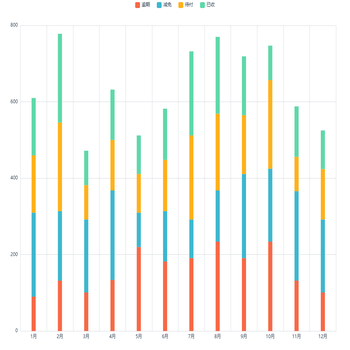
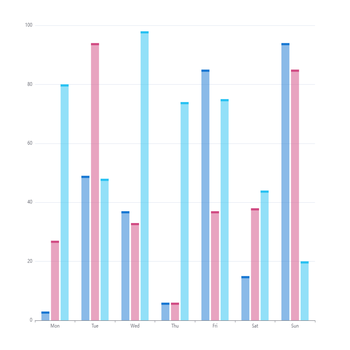
![[dataset渐变柱状图] 每月融资额/还款额](https://www.mjrooo.com/assets/image-173349236529957.png)